By Sustainability Coordinator Jacqui Moy
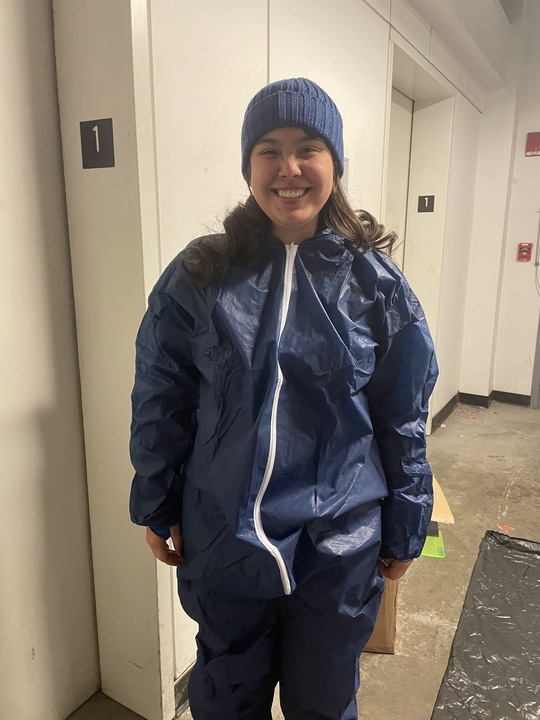
Waste Diversion Fellow, Ria Wipperfurth suited up for our waste audit.
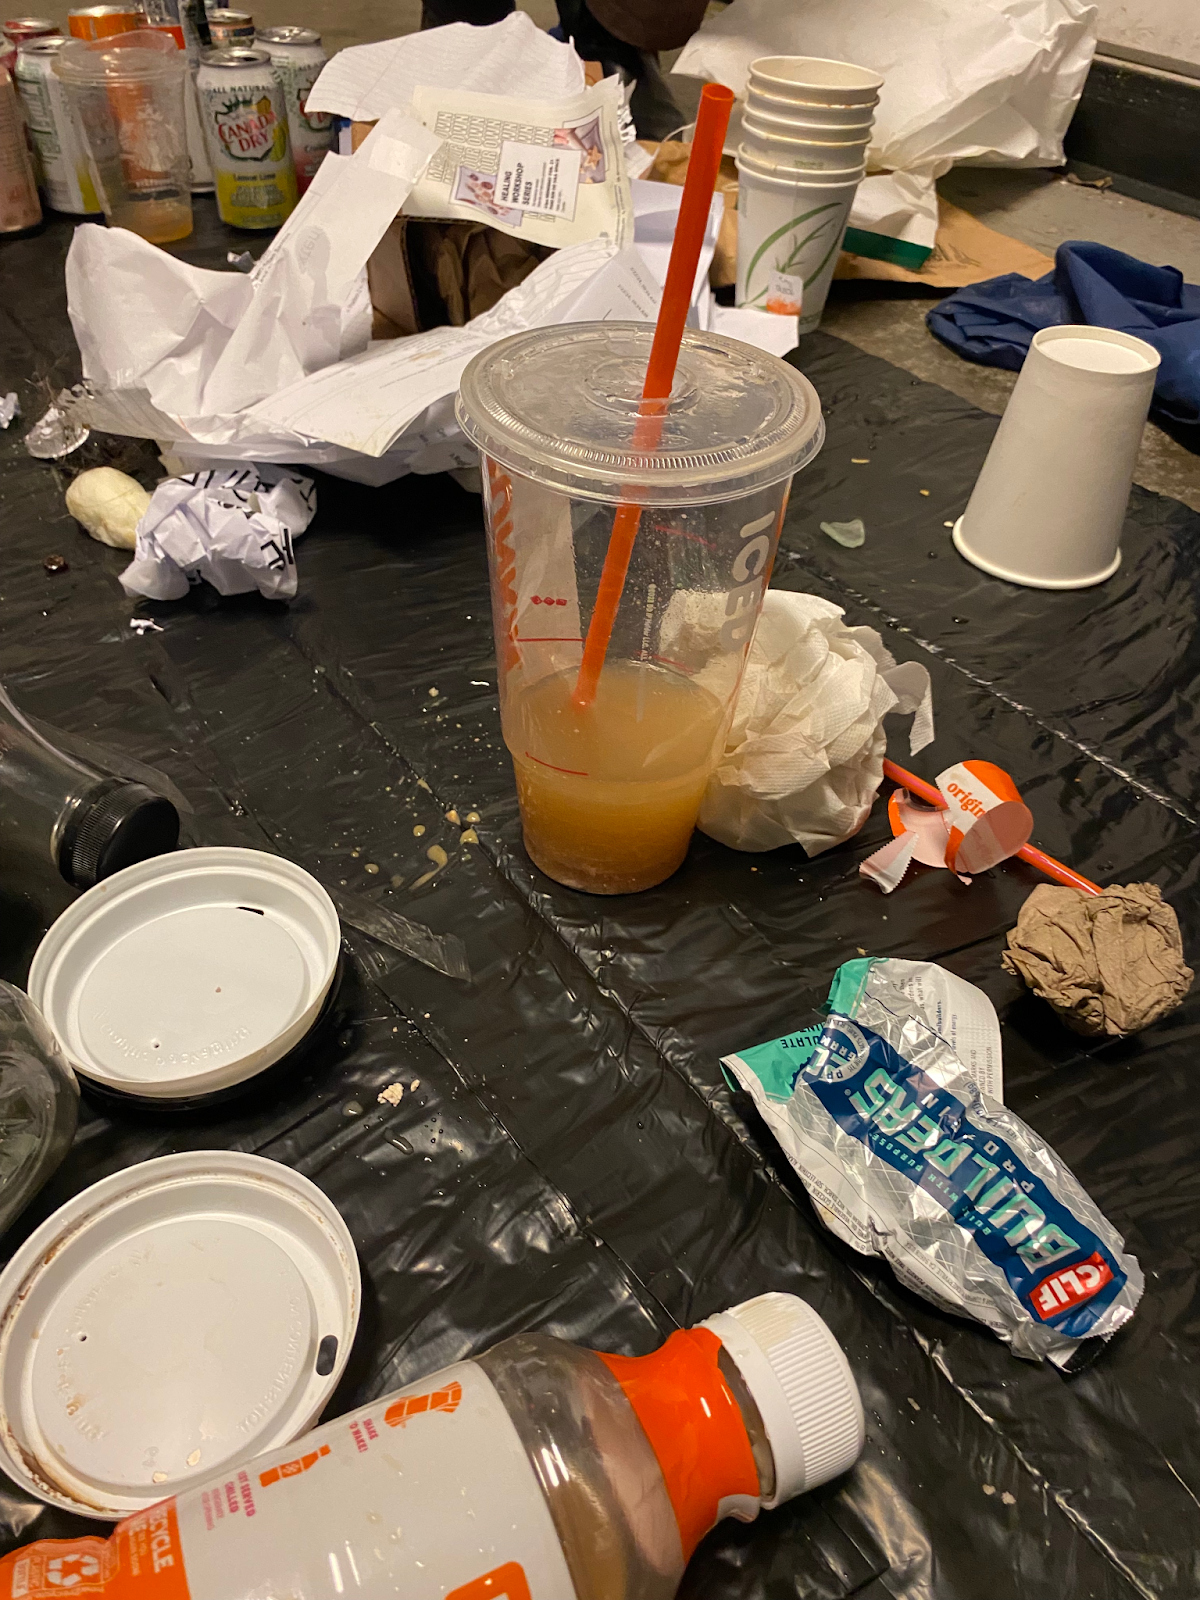
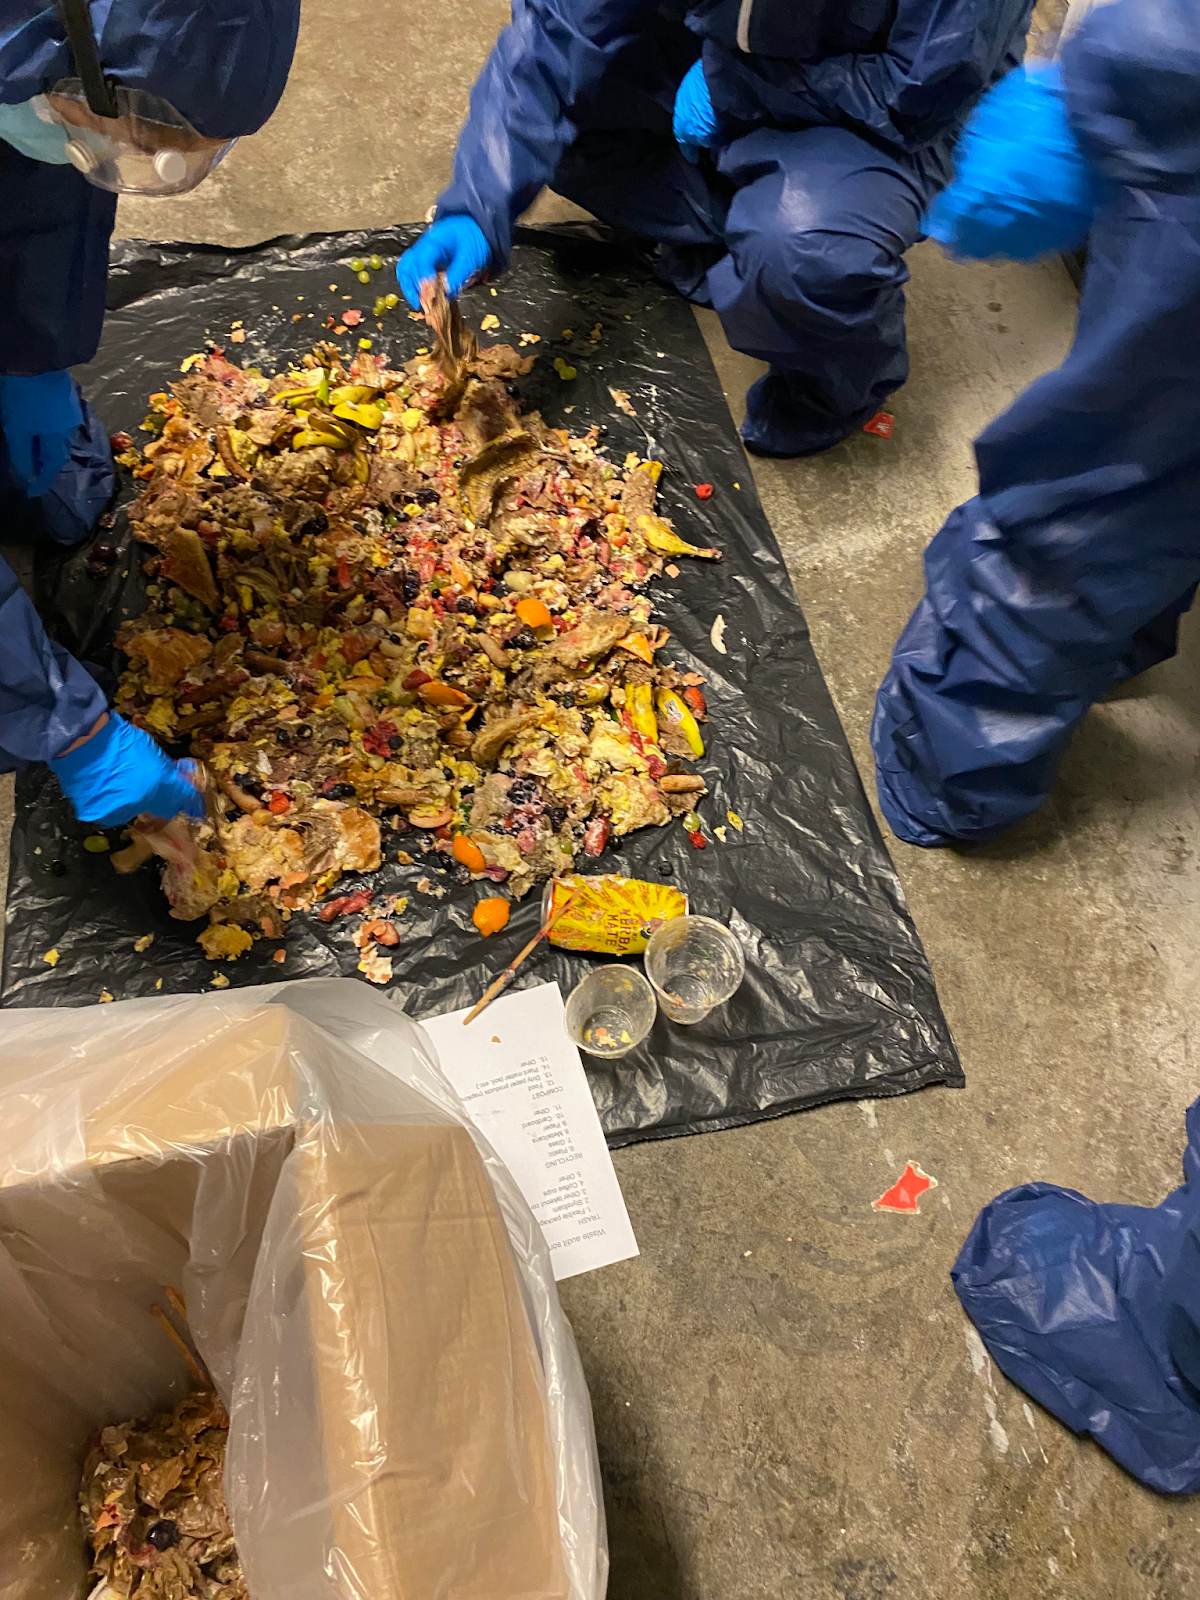
On February 26th, the Emerson sustainability team dug deep into bags of compost, recycling, and trash from campus buildings to audit our waste. I know- yuck! But, in this gross yet enlightening process, we aimed to identify missed waste diversion opportunities, sources of contamination, and significant subcategories of each waste category. With protective gloves, masks, suits, and goggles, Sustainability Fellows sorted three bags from each category of waste (compost, recycling, and trash) into the following subcategories:
- Compost
- Food
- Dirty paper products (napkins, etc.)
- Plant matter (soil, etc.)
- Other
- Recycling
- Plastic
- Glass
- Metal (cans)
- Paper
- Cardboard
- Other
- Trash
- Flexible packaging
- Foam (besides coffee cups)
- Takeout containers
- Coffee cups
- Other
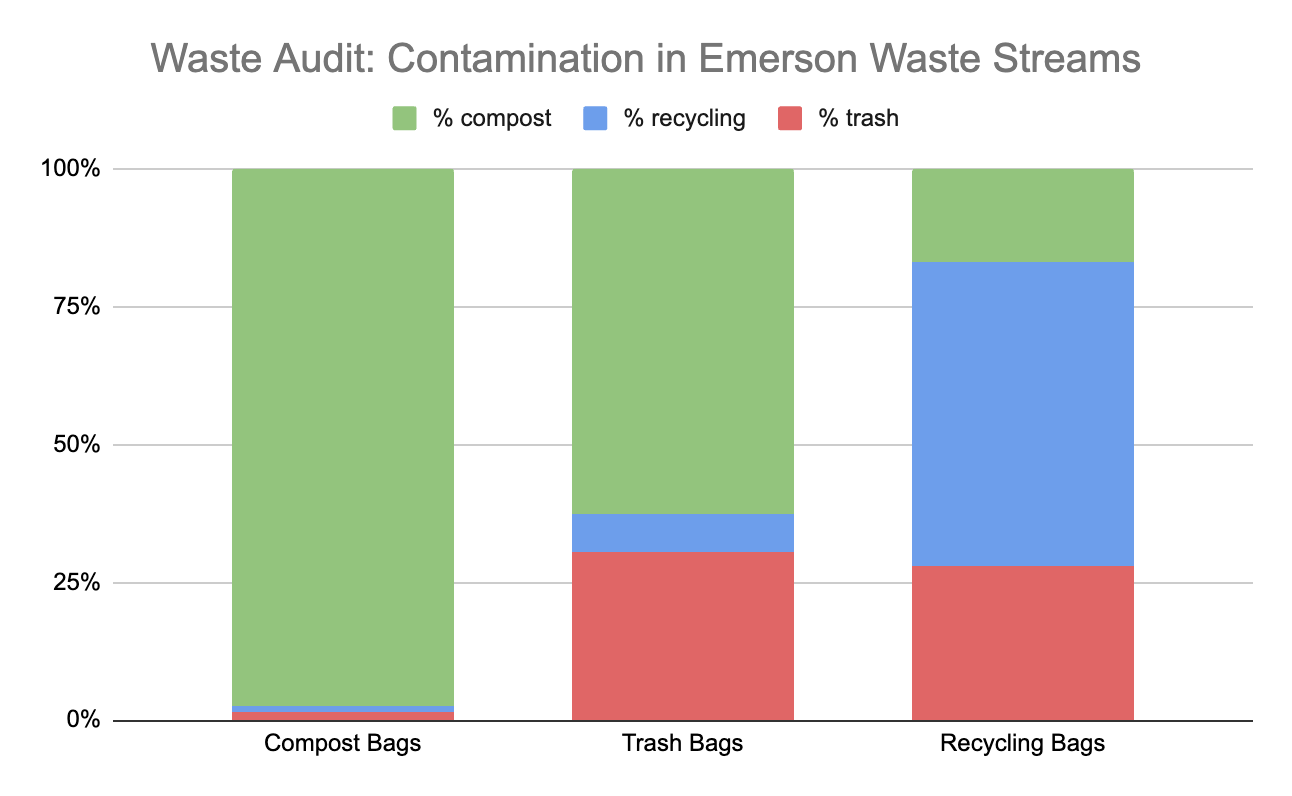
After sorting, each subcategory was weighed. Below is a breakdown of the percent of compost, recycling, and trash items found in bags from each category of waste.
Here are some major insights the we gained:
Compost: On average, 93% of waste in compost bags belonged in the compost (the rest being contaminants). This is a great ratio of compost to contaminants! Food waste was the largest compost subcategory.
Recycling: On average, 63% of waste in recycling bags was recyclable and paper/cardboard was the largest recycling subcategory. There were a lot of dirty paper cups in recycling bags. Instead, these should be put in compost bins if they’re compostable, or trash bins if they’re not compostable. There was also a lot of liquid left in recyclable plastic cups. This liquid can contaminate other recyclable materials like cardboard. Be sure to empty your cups and bottles before recycling!
Trash: On average, 36% of waste in trash bags actually belonged in the trash and flexible plastics were the largest trash subcategory. We found a lot of compostables in the trash. While we still encourage the norm of “when in doubt, throw it out,” we can all still do a better job identifying recyclables and compostables to keep them out of the trash stream.
This data from this waste audit also helped to inform decisions for our new waste signage we are designing, potential changes in bin locations, and future waste education and engagement opportunities. We’ll be conducting more waste audits in the future so stay tuned for future results. In the meantime, make sure your recyclables are empty, clean, and dry, and to compost all your leftover food if you have access to a compost bin!