
The Switch: Goodreads to The StoryGraph
By Elisabeth Grass
Every avid reader, and most not-so-avid readers, know about the wildly popular book-logging site Goodreads. It has been the frontrunning social cataloging website for years, and currently has over 125 million users, which is a little over a third of the entire U.S. population. It is certainly a convenient resource for readers of all kinds, allowing individuals to set reading goals for the year, review books, create personal lists, and so much more. I was introduced to Goodreads in high school, but my time as a frequent user was short-lived, as I was soon after introduced to an alternative cataloging platform, known as The StoryGraph.
If you haven’t heard of The StoryGraph (or as most people refer to it, just StoryGraph), it functions very similarly to Goodreads, in that it allows you to track which books you have read, want to read, and whatnot. However, unlike Goodreads, which is owned by Amazon, StoryGraph is a Black woman-owned independent company, founded by CEO Nadia Odunayo in 2019.
Ever since making the switch from Goodreads to StoryGraph (my username is elisabeth_e, if you’re curious), I have urged many of my peers to follow in my footsteps, as I find it much more user-friendly (and aesthetically pleasing) than Goodreads; additionally, by supporting this platform over Goodreads, you are contributing less money to Amazon, a billion-dollar company founded, and still partially owned and profited off, of by a white male billionaire (booooo Jeff Bezos). Allow me to divulge some of my favorite aspects of the StoryGraph user experience, in hopes that you might sign up as well.
One thing I want to point out before we get into it, though, is that StoryGraph is a much less social platform than Goodreads; there are currently no spaces for writing discussion posts, joining groups, replying to reviews and comments, sending messages, bookmarking quotes, or following authors. I know this list sounds expansive, and if these elements of Goodreads are sacred to you, then by all means feel free to continue using it as you normally would. However, I hope the following information convinces you to at least give StoryGraph a chance, and perhaps even use it in tandem with Goodreads as we await further updates to the platform.
If you’re intrigued about signing up to StoryGraph but concerned about the idea of starting over in terms of your book-logging experience, fear not. StoryGraph has a handy little feature that allows new users to import their Goodreads data, including book reviews and which books have been marked as read/currently reading/to read. Once you register, you’ll be directed to a screen that provides you with the necessary steps you can take to upload your Goodreads data. Depending on your history, it might take some time, but StoryGraph typically manages to complete the import within 24 hours.
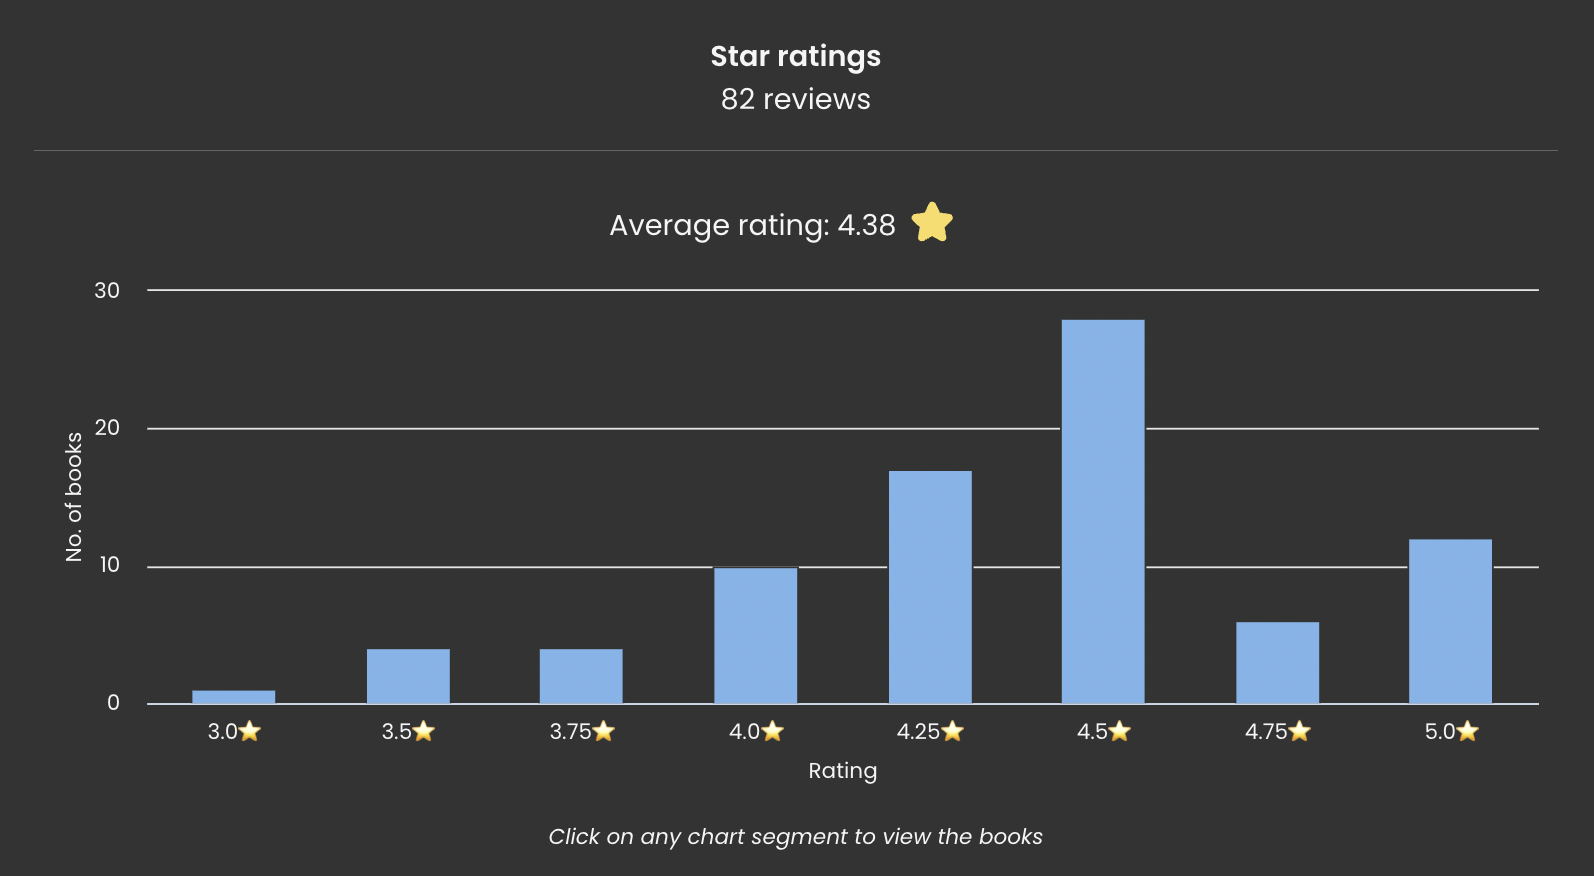
One thing I really like about StoryGraph as a rather indecisive person is that the rating system functions on quarters of stars. Say you like a book, but a four star rating feels too generous, and three stars feels too low; StoryGraph allows you to rate it 3.25, 3.5, or 3.75, whichever suits your fancy. I know I take advantage of this system all the time, because the constraint of rating a book on a scale of 1 to 5 with no in-between options often feels disingenuous to my actual reading experience.
In the same vein of the review system, another neat feature offered by StoryGraph is the content warning list that appears under almost every book. The list is based on other people’s reviews, as you are able to input content warnings that you think are relevant and useful for readers who might be sensitive to certain topics. The warnings are also ranked in terms of severity, so as to give wary readers an idea of how graphic the book might be before fully diving in. More and more books nowadays are slowly including content warnings in the beginning pages, but the majority still do not; StoryGraph allows you to easily find out what trigger warnings are applicable without having to go on a lengthy internet hunt.
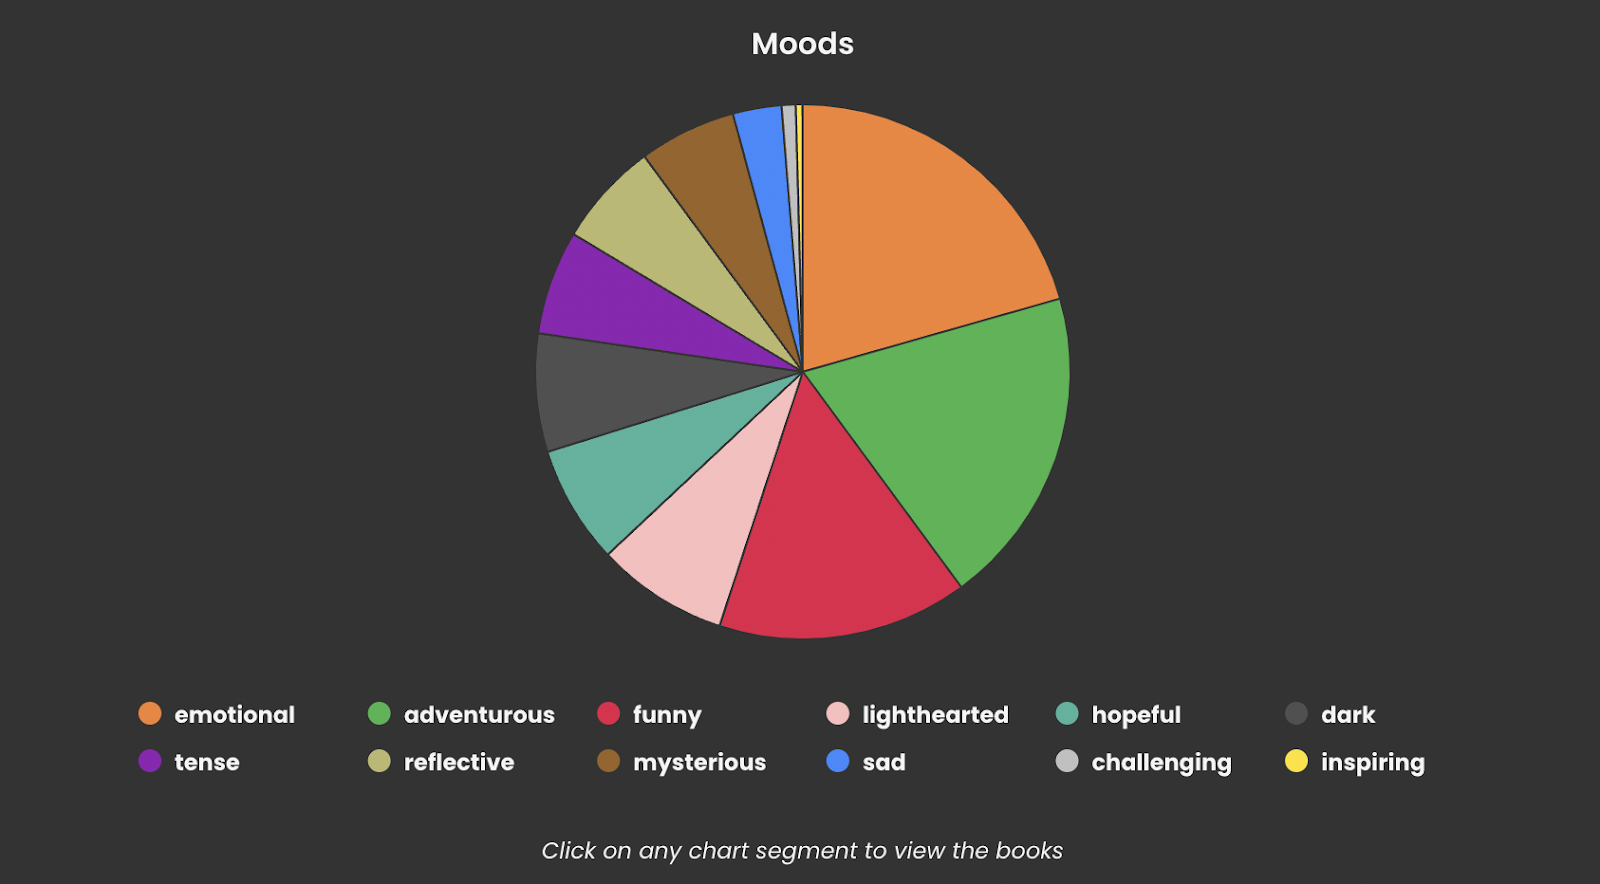
Finally, I want to talk about my personal favorite element of the StoryGraph user experience, which is the statistics page that can be accessed under your profile tab. This page gives you a breakdown of everything you’ve read within a customized span of time, organizing it all into colorful pie charts and bar graphs for you to marvel at. StoryGraph categorizes things like moods, pace, page range, genre, format, and how many books per individual rating. It’s quite fun, especially at the end of the year when you’re reflecting on your self-imposed reading goal, to browse through the various graphics and see your year at a glance. It’s like the bookish version of Spotify Wrapped, except accessible every day of the year.

I’ve been using StoryGraph for a while now, and it has been an incredibly convenient tool, especially as I have been forcing myself out of my years-long reading slump. Though it’s less of a social platform than Goodreads (which I personally have no issue with, but of course not everyone feels the same as I do), the various features I have listed as well as plenty of others have made my book-logging experience simple, well-informed, and entertaining. If you have not already signed up for an account, I highly urge you to do so; not only are you sparing your eyes from the egregious graphic design of the Goodreads site, but you are also, more importantly, supporting a Black woman-owned platform in lieu of a billion-dollar company.
Intriguing.
I’m going to check it out.
Yes I am going to download it today. My main concern was getting my data from Goodreads and that will be taken care of. Thanks so much.
Last week my co-worker and I were talking about our book goals for the year. I introduced her to Good Reads giveaways. Yesterday she pointed out her to reads hard exponentially grown bc entry’s are added to the yo read list. Just read the rules: will be added and must remain on to to read thru contest period. Was like huh, who owns gr… so I went looking. Surprise indeed! Had no idea of Amazon acquiring that long ago. Gobsmacked! I’m checking out storygraph—I hope it’s what gr was in the beginning
Thanks for sharing this. I am all in