
Access to Learning Analytics inside Canvas
This article provides instructors with tutorials for accessing course and student analytics in Canvas. Canvas Analytics provides an overview of students’ activity within your course. You can use this data in correlation with student performance to inform instructional decisions in your course.
Course Analytics Overview
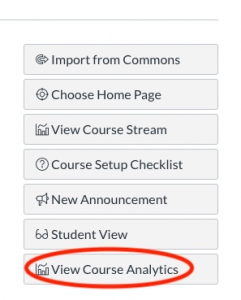
To open Course Analytics, click on the “View Course Analytics” on the top-right sidebar of your Home page. (Please note that “View Course Analytics” is only available when the course is published)
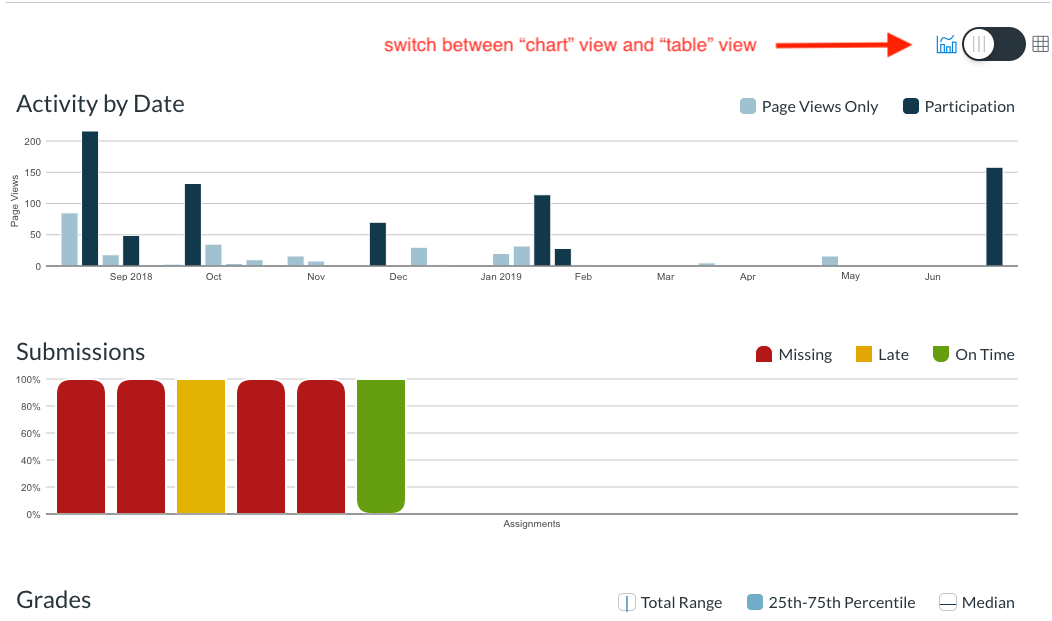
By default, the Analytics page displays in chart view, you can hover over the bars for details:

You may click the toggle on the top right to change to the “table” view.
- Activity by Date: displays page view and participation activity within your Canvas course.
- Submissions: displays a bar for each assignment in your course.
- Grades: displays the grade distribution for assignments that have been graded.
Student Analytics Overview
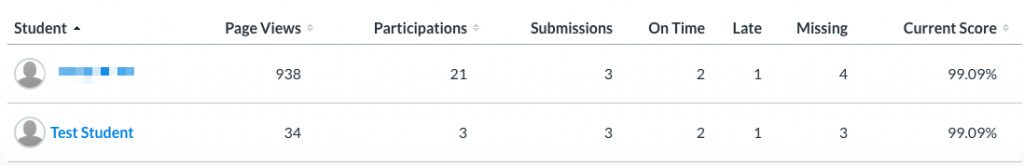
On the bottom of the Course Analytic Overview page, you will see the Student Analytics Overview, which displays a list of all students in the course. You can sort the table by student name by clicking the sort arrow. You can also view and sort the table by student course page views, participation, and their current score percentage.
To view analytics for an individual student, click the student’s name. The student analytics page displays the student’s name and their current total grade. You can also send a message directly to the student from this page by clicking the envelope icon. The course name displays on the page, along with a menu that allows you to move from one student to another. Use the arrows to see the next or previous student’s analytics.
Like the Course Analytics page, the Student Analytics displays several charts:
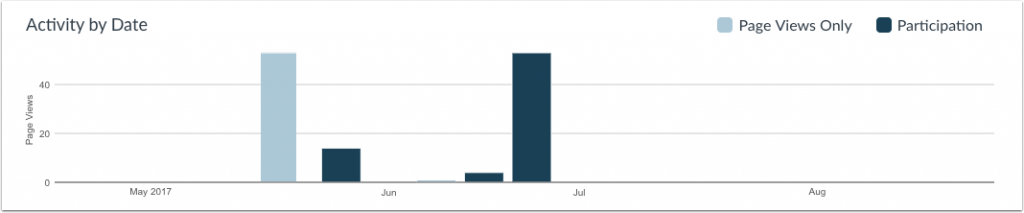
- Activity by Date: displays a student’s page views and participation in your course.
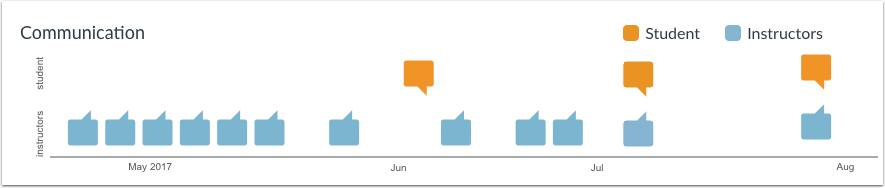
- Communication: outlines communication information between instructor and student.
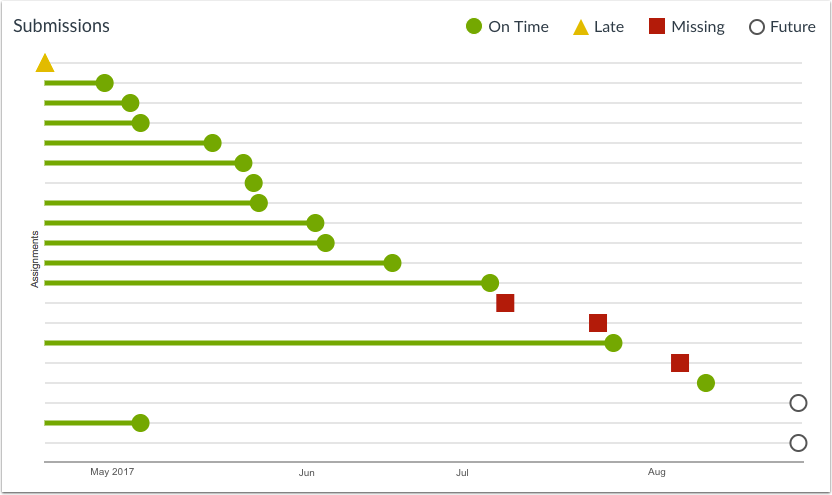
- Submissions: displays the student’s assignment submission details.
- Grades: provides assignment grade information about the student in comparison to the rest of the class.
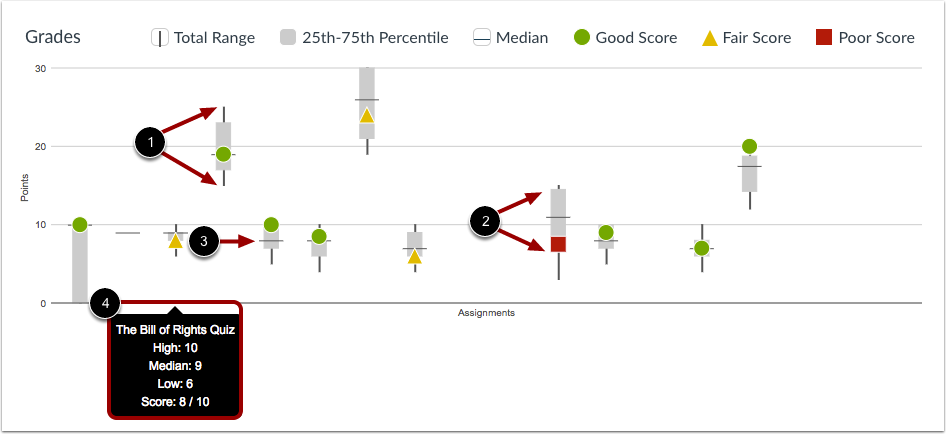
1)The vertical black line—from the highest score to the lowest score2)The gray box—from the 75th percentile to the 25th percentile3)The horizontal black line—the median score for the assignment4)To view assignment names and details, hover your cursor over the graph.
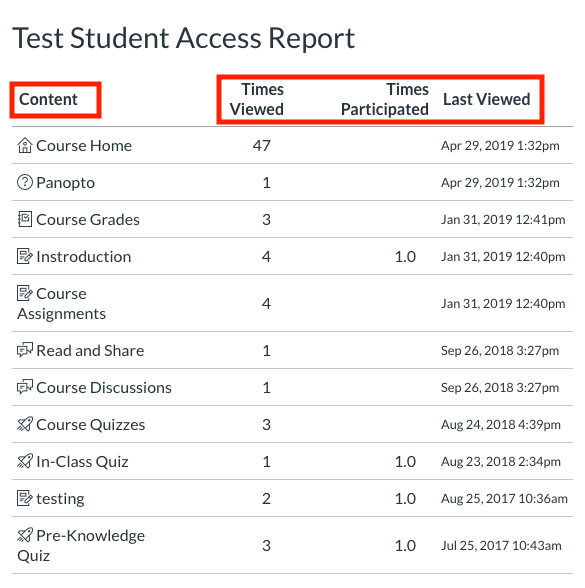
Student Access Report
Clicking the student’s name will take you to the student’s user details page where you can view this student’s Access Report.
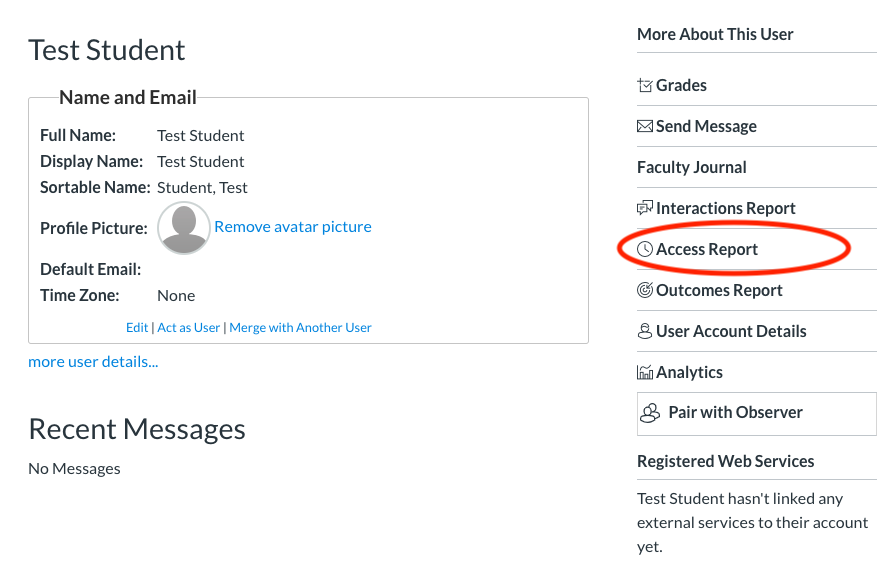
This report includes information about the pages a student viewed as well as when they last participated in an activity on that page.
Additional information related to Learning Analytics:
- It is important to conduct a literature review before you start the learning analytics process. Having a better understanding of learning analytics topics such as page view patterns will bring you insights for thinking about your own analytics methods.
- It is worth reviewing the ethical portions of your learning analytics plan. You may want to examine whether there is a possibility of incorrect use of learning analytics, for example, possible holding stereotypes when interpreting data could arouse threats to less privileged groups.
- It is sufficient to understand the data privacy issues by looking at legal requirements, and scholars’ concerns about student privacy violations.